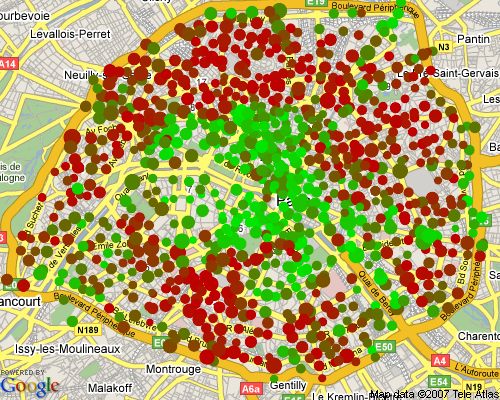
Velib is a pretty neat service I use every week to move inside Paris. I have an annual subscription (30€) which lets me borrow a bike for half an hour from one station and leave it to another. As both a confirmed geek and a Velib fan, I wanted to get an overview of the areas where bikes are available at a specific time of the day (here on 26th of March, around 1:43pm):
This article (for educational purposes only) describes how to create this picture using the Ruby language and the RMagick library.
Grabbing the necessary data
Availabilities of bikes at a Velib station
Using FireBug Network Monitoring on the Velib website, we see that availabilities for each station are published at the following url (here for station #20017):
http://www.velib.paris.fr/service/stationdetails/20017This url will return the following XML back (here 15 bikes are available for use on a total of 29 bikes slots):
<station>
  <available>15</available>
  <free>11</free>
  <total>29</total>
  <ticket>1</ticket>
</station>
Latitude and longitude of a Velib station
Using FireBug again we find that stations coordinates are available here:
http://www.velib.paris.fr/service/cartoHere’s an extract of this file (note the lat/lng attributes in the marker tag):
<carto>
  <markers>
    <marker name="20017 - RUE SAINT BLAISE" number="20017" address="69 RUE SAINT BLAISE -" fullAddress="69 RUE SAINT BLAISE - 75020 PARIS" lat="48.8568138966" lng="2.4090329253" open="1"/>
  </markers>
</carto>
Give me a background map, please!
We’ll use the Google Maps Static API (free registration required) to retrieve the background map through the following url:
"http://maps.google.com/staticmap?center=#{lat},#{lon}&zoom=#{zoom_level}&size=#{size}&key=#{GOOGLE_MAPS_API_KEY}" After a bit of trial, the center of Paris is roughly at latitude 48.856667, longitude 2.335987. I write that down.
Plotting the stations on the map
How to translate the latitude and longitude of a station to pixels coordinates?
We can retrieve the bounding box (north-east-south-west) from the Paris-centered map using Google Maps API getBounds() method:
<!DOCTYPE html "-//W3C//DTD XHTML 1.0 Strict//EN"
"http://www.w3.org/TR/xhtml1/DTD/xhtml1-strict.dtd">
<html xmlns="http://www.w3.org/1999/xhtml">
<head>
<meta http-equiv="content-type" content="text/html; charset=utf-8"/>
<title>Google Maps JavaScript API Example</title>
<script src="http://maps.google.com/maps?file=api&v=2&key=YOUR_API_KEY_HERE"
type="text/javascript"></script>
<script type="text/javascript">
function initialize() {
if (GBrowserIsCompatible()) {
var map = new GMap2(document.getElementById("map_canvas"));
map.setCenter(new GLatLng(48.856667,2.335987), 12);
var bounds = map.getBounds();
var sw = bounds.getSouthWest();
var ne = bounds.getNorthEast();
document.getElementById("infos").innerHTML = sw + ne;
}
}
</script>
</head>
<body onload="initialize()" onunload="GUnload()">
<div id="map_canvas" style="width: 500px; height: 400px"></div>
<div id="infos"/>
</body>
</html>This HTML will display the bounds we need, and we write them down:
SOUTH = 48.811385499847525
WEST = 2.2501373291015625
NORTH = 48.901740646573025
EAST = 2.4217987060546875
To translate a station coordinates to pixels coordinates suitable to draw on our map, we can use linear interpolation (it’s good enough in our case, at least!). This code will do the trick:
def interpolate(lo_to,hi_to,lo_from,hi_from,current)
  lo_to + (current-lo_from)*(hi_to-lo_to)/(hi_from-lo_from)
end

def latlon_to_screen(lat,lon)
  [interpolate(0,WIDTH,WEST,EAST,lon),interpolate(0,HEIGHT,NORTH,SOUTH,lat)]
end
You see that this way the South West bound will have pixel coordinates (x=0,y=HEIGHT) while the North East bound will have pixel coordinates (x=WIDTH,y=0), and that’s a good thing.
Choosing a visualization model
I settled with this model (although many others are possible):
- one disc per station
- the area (not the radius) of the disc should reflect the total number of bikes
- the color of the disc should reflect the availability rate (availables bikes / total bikes), ranging from red (no bike available) to green (all bikes available)
Drawing the station
We’ll use linear interpolation again to compute a gradient of color and use RMagick to fill the discs representing the stations:
def draw_station(image,x,y,available,total)
  gc = Draw.new
  availability_rate = 100.0*available/total
  red = interpolate(190,0,0,100,availability_rate)
  green = interpolate(230,0,100,0,availability_rate)
  gc.fill = "rgb(#{red},#{green},0)"
  gc.circle(x,y,x-Math.sqrt(total),y)
  gc.draw(image)
end
Putting it all together
We use the following libraries:
- open-uri to handle downloads
- RMagick for image processing
- Hpricot to parse the XML content
We take care of keeping a local copy of the downloaded data to avoid polling the Velib server unnecessarily while experimenting.
Here’s the whole code:
require 'rubygems'
require 'open-uri'
require 'hpricot'
require 'rmagick'
include Magick

# a few constants first
GEODATA_FILE = 'carto.xml'
MAP_FILE = 'map.gif'
GOOGLE_MAPS_API_KEY = 'YOUR-GOOGLE-MAPS-API-KEY-HERE'

# the map bounding box
SOUTH = 48.811385499847525
WEST = 2.2501373291015625
NORTH = 48.901740646573025
EAST = 2.4217987060546875

# center of the map
CENTER = [48.856667,2.335987]

# size of the map in pixels
WIDTH = 500
HEIGHT = 400

# interpolate from [lo_from..hi_from] to [lo_to..hi_to]
def interpolate(lo_to,hi_to,lo_from,hi_from,current)
  lo_to + (current-lo_from)*(hi_to-lo_to)/(hi_from-lo_from)
end

# convert a latitude / longitude to screen coordinates
def latlon_to_screen(lat,lon)
  [interpolate(0,WIDTH,WEST,EAST,lon),interpolate(0,HEIGHT,NORTH,SOUTH,lat)]
end

# draw a single station on an image
def draw_station(image,x,y,available,total)
  gc = Draw.new
  availability_rate = 100.0*available/total
  red = interpolate(190,0,0,100,availability_rate)
  green = interpolate(230,0,100,0,availability_rate)
  gc.fill = "rgb(#{red},#{green},0)"
  gc.circle(x,y,x-Math.sqrt(total),y)
  gc.draw(image)
end

# download content from an url and cache it on the disk
def download_file(url,filename)
  unless File.exists?(filename)
    File.open(filename,'w') do |output|
      open(url) { |input| output << input.read }
    end
  end
end

def url_for_map(lat,lon,zoom_level=12,size="#{WIDTH}x#{HEIGHT}")
  "http://maps.google.com/staticmap?center=#{lat},#{lon}"+
  "&zoom=#{zoom_level}&size=#{size}&key=#{GOOGLE_MAPS_API_KEY}"
end

# retrieve the station status - and keep a cache of the data in a file
def get_station_status(id)
  filename = "station-#{id}.xml"
  download_file("http://www.velib.paris.fr/service/stationdetails/#{id}",filename)
  Hpricot(IO.read(filename))
end

# build the map url and download it
download_file(url_for_map(CENTER[0],CENTER[1],12),MAP_FILE)

# download the stations coordinates
download_file("http://www.velib.paris.fr/service/carto",GEODATA_FILE)

#image = Image.new(WIDTH,HEIGHT) { self.background_color = 'transparent' }
map = Image.read("map.gif").first

# iterate over the opened stations
stations = Hpricot(IO.read(GEODATA_FILE))

stations.search('/carto/markers/marker[@open="1"]').each do |station|
  # retrieve the coordinates convert them to screen coordinates
  x,y = latlon_to_screen(station[:lat].to_f,station[:lng].to_f)

  # retrieve the available and total bikes count using the station number
  station_status = get_station_status(station[:number])
  available = station_status.search('available').inner_text.to_i
  total = station_status.search('total').inner_text.to_i

  # draw this station on the map
  draw_station(map,x,y,available,total)
end

# save the resulting map
map.write("map.png")